Profit & Loss
How did we do?
Over a date range you pick.

Getting Started with Rundoo · Accounting
P&L, balance sheet, and the general ledger.
At the end of the month, or any time you want to check in on the business, you need to know exactly where you stand. Rundoo keeps the three reports you'll reach for most in one place, and every number on them is a live link straight to the transactions behind it. This guide walks all three, one at a time.
All three live under Admin › Reporting, as three tabs: Profit & loss, Balance sheet, and General ledger. Each one opens empty on purpose. You pick a date, click the blue Run button, and Rundoo pulls the entries and adds them up. Nothing renders until you hit Run, so if a report looks blank, that's your cue to set a date first.
Open the Profit & loss tab. Click the Date pill, pick a range (a preset like Last month or your own From/To), then click Run. The report reads top to bottom the way you'd expect: Income at the top, minus COGS (your cost of goods sold), which gives you Gross profit. Then your operating Expense comes out, and what's left is the bottom line. Rundoo labels it Net profit. If you're used to QuickBooks or Xero calling that "Net income," it's the same number, just a different name on the row.
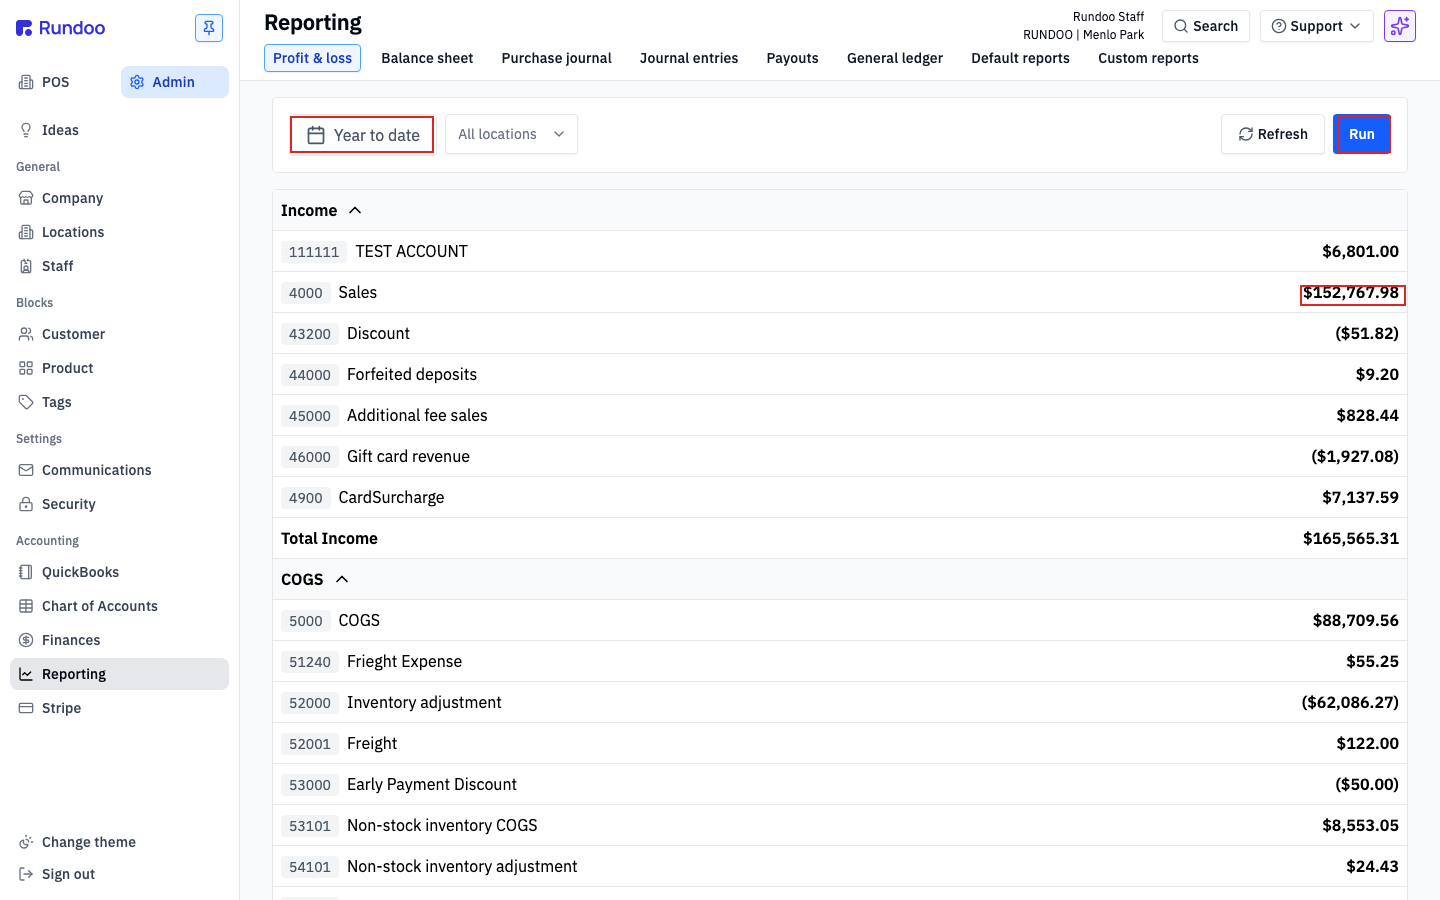
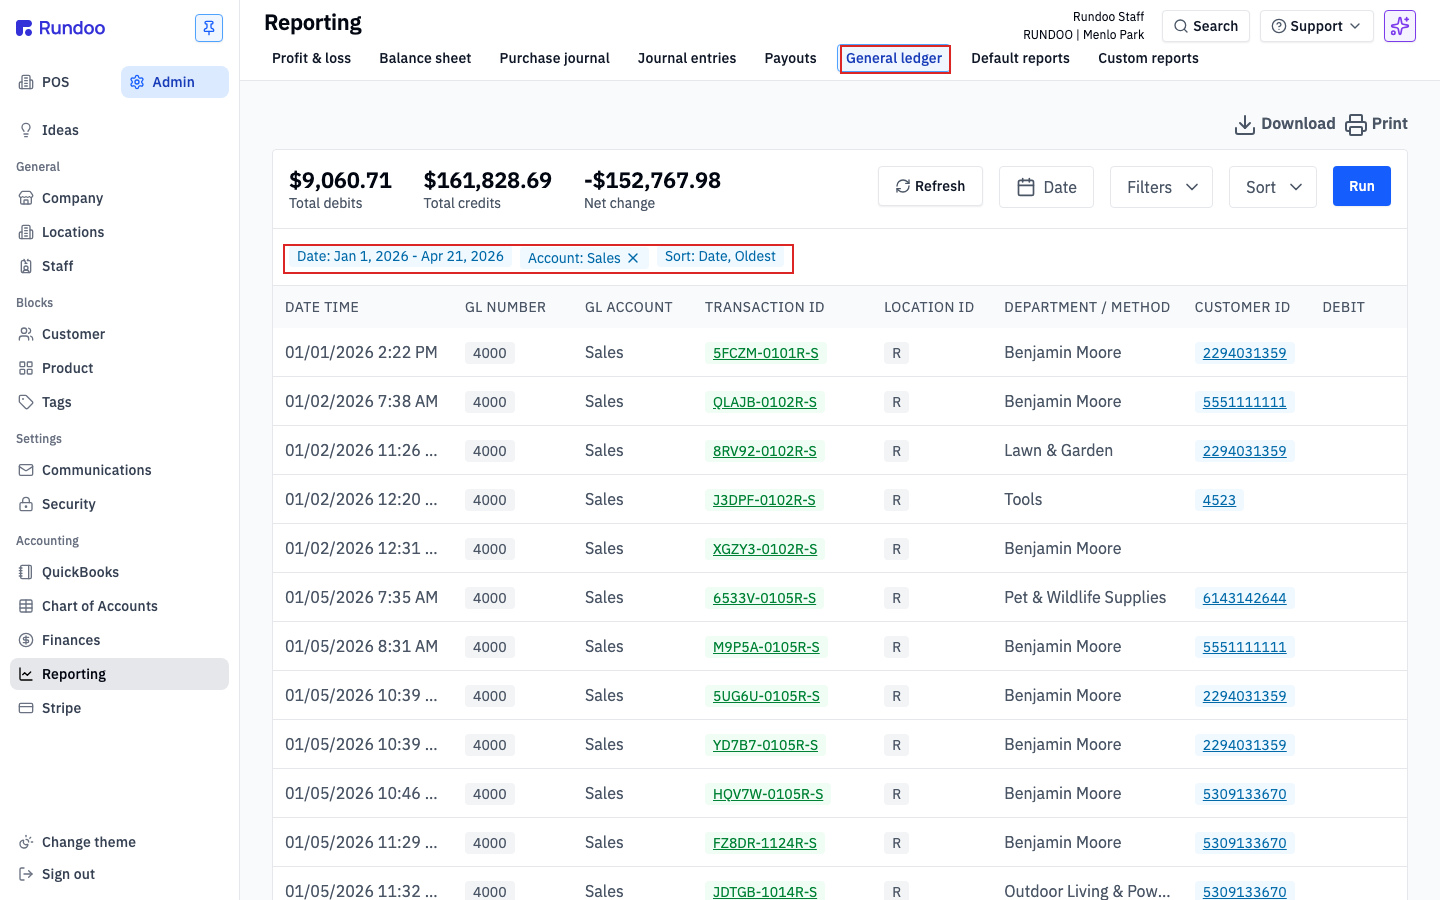
Follow any number to its source. Every dollar amount on the P&L is a link. Click one, say the total next to Sales, and Rundoo drops you into the General ledger tab with the date and that account already filtered. Click Run there and you're looking at every entry that added up to that number.
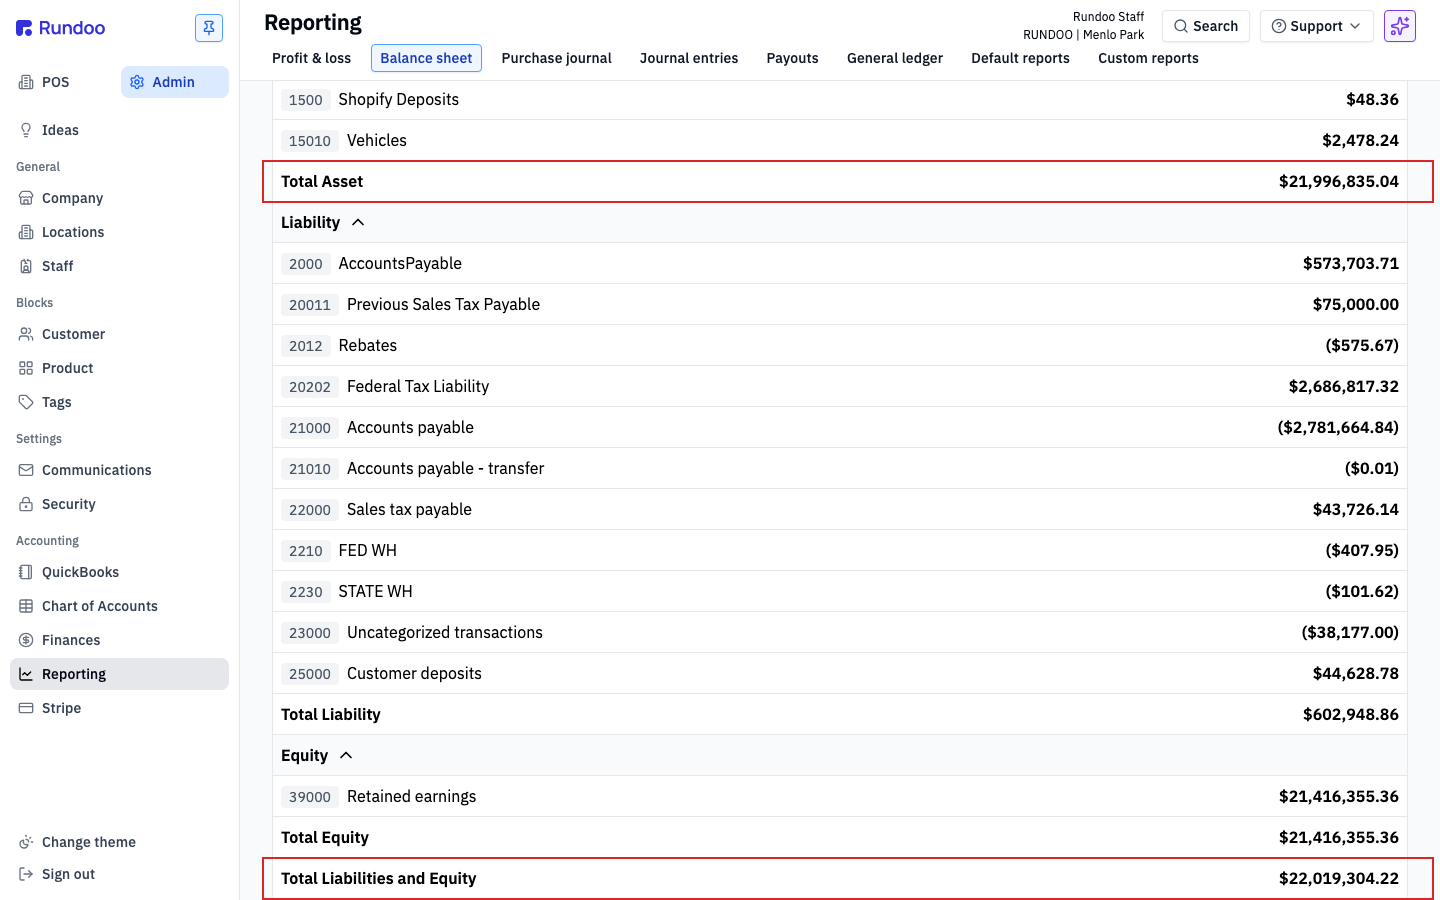
Click the Balance sheet tab. This one is a snapshot of a single day, not a range. Click the date button on the left (it defaults to Today), pick the day you want (the last day of the month is the usual choice), and click Run. You'll see your Assets up top, then Liabilities, then Equity, each with a section subtotal.
The 10-second health check: Total Asset at the top should match Total Liabilities and Equity at the very bottom. That's the accounting identity (Assets = Liabilities + Equity). If the two don't line up, it's a sign to check your starting balances back in Admin › Chart of Accounts, where a yellow banner flags any date the two sides don't balance.
Click the General ledger tab. Set the Date pill to your range, then open Filters and narrow the scope before you run, otherwise a busy month can pull thousands of rows. Choose Account and check the one you want (say your main Sales account). You can stack more filters here too, by location, tender method, transaction type, and more. Click Run and you get a clean list. Up top, three pills show Total debits, Total credits, and Net change. Each row's transaction ID links back to the sale, order, or payment that created it.
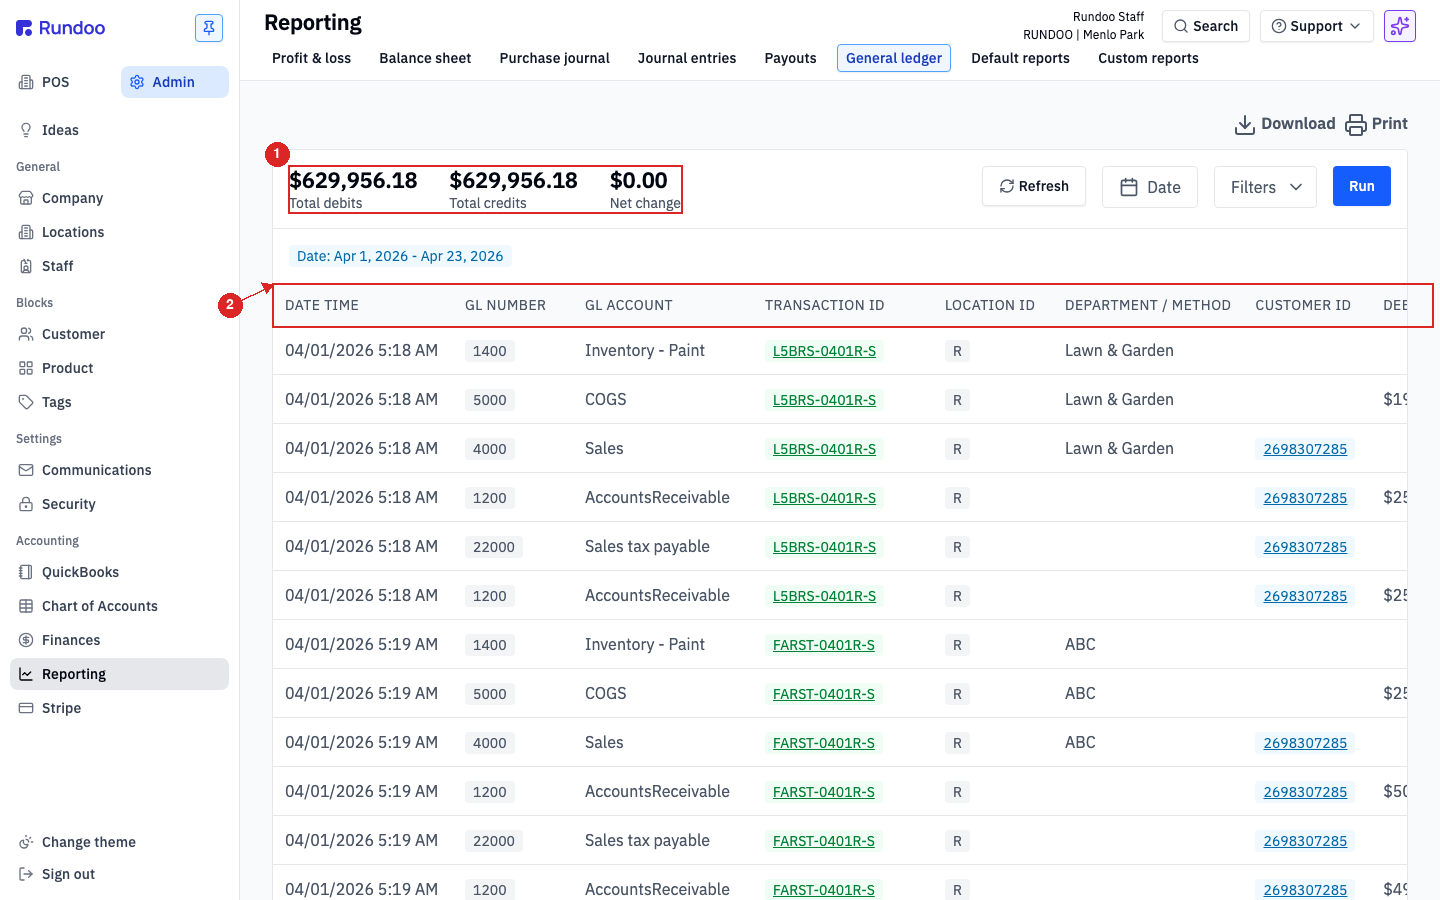
When your accountant asks for it, the Download and Print buttons sit at the top right. Download gives you a CSV of exactly the rows you filtered to, ready for Excel or to email over. The General ledger is the one Reporting tab with its own export, so if you want a P&L or balance-sheet total on paper, drill into a number first and export from here.
Profit & Loss
How did we do?
Over a date range you pick.
Balance Sheet
Where do we stand?
A single day, not a range.
General ledger
What's behind the number?
Every line, any range.
Share it
Hand it to your accountant
General ledger › Download (CSV).
Good to know