Where
POS → Analytics → Reports
Dozens of default reports, ready to run.

Getting Started with Rundoo · Reporting
Open a report, set the date and columns, and export what you find.
You know your business inside and out, and every day you ring up sales you are building a rich history of what your customers buy, and when. Sometimes you just want a quick answer out of that history. Who were my top ten customers this month? Which department had the best margin? Rundoo's Report Builder is how you ask those questions and get the answer in a few clicks. This guide is about running a report to get an answer right now. Saving one you will want again is the next video, Your Own Reports.
In POS mode, look in the left sidebar for the Analytics group, then click Reports. You land on a searchable list of every report Rundoo ships with, dozens of them already built for you. Each row shows its Base data, which is the part of your business it pulls from, like Sold products, Aging detail, or Transactions.
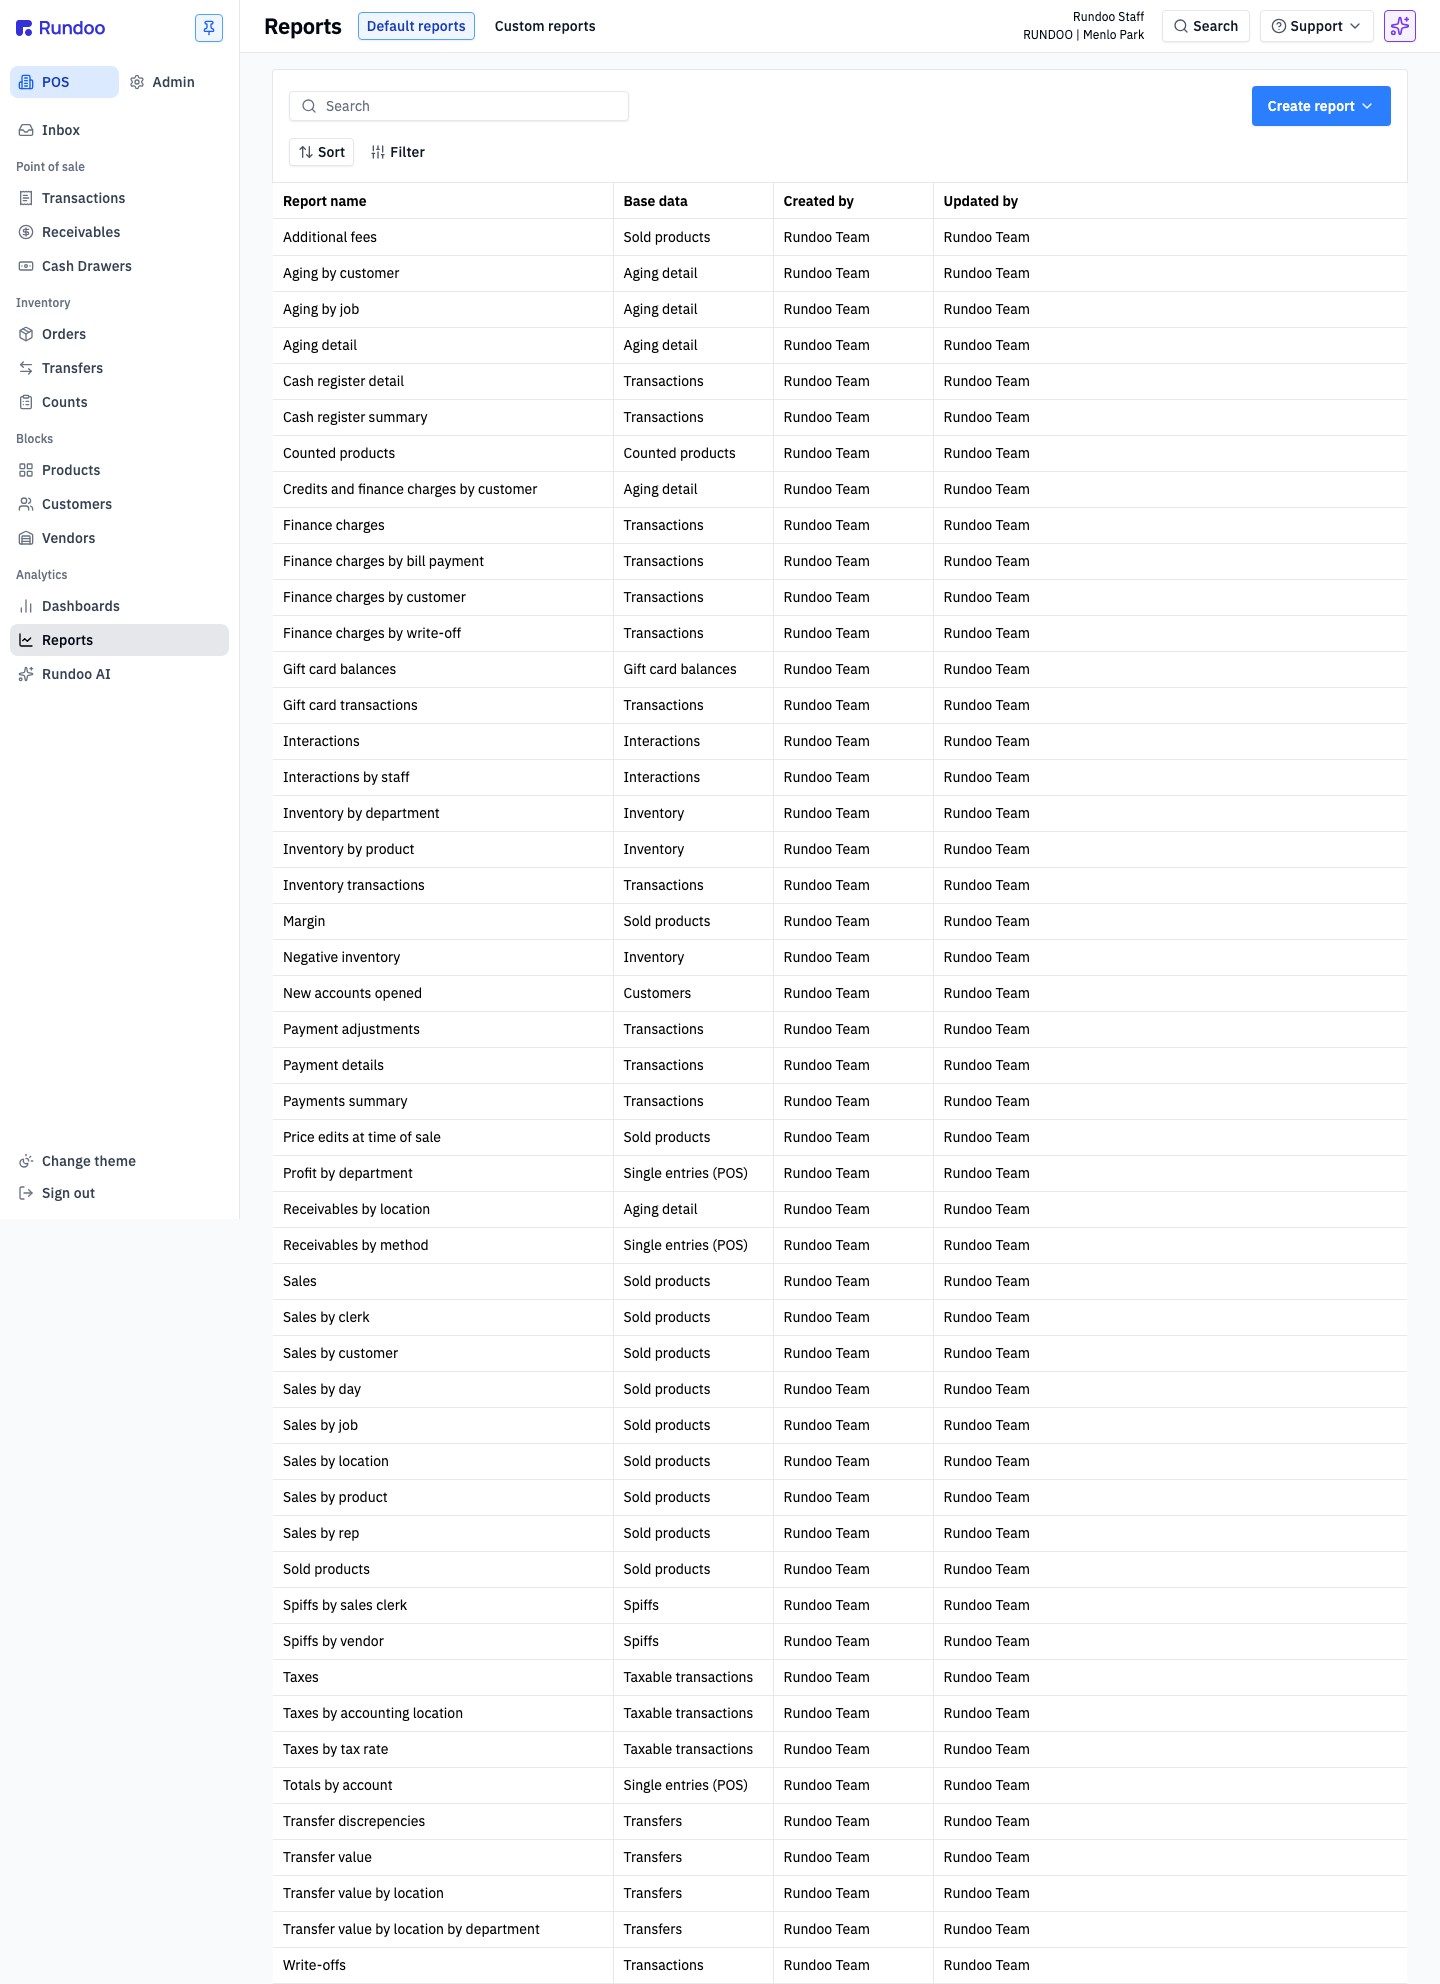
If you do not see Reports in the sidebar at all, that is usually a permission setting. Ask your management team to check your staff role.
Type into the Search box or scroll to find the report closest to what you are asking. For a customer question, Sales by customer is a good one to start with. Click its row and it opens in the builder.
When a report opens it comes with a standard set of columns and a date range already applied. The date is the first thing to check, because a report can open on a narrow window like Today and make your numbers look low. Click the colored Date range pill and pick the window you want. There are presets for Today, Month to date, Year to date, and All time, plus a custom range. The report updates as soon as you choose.
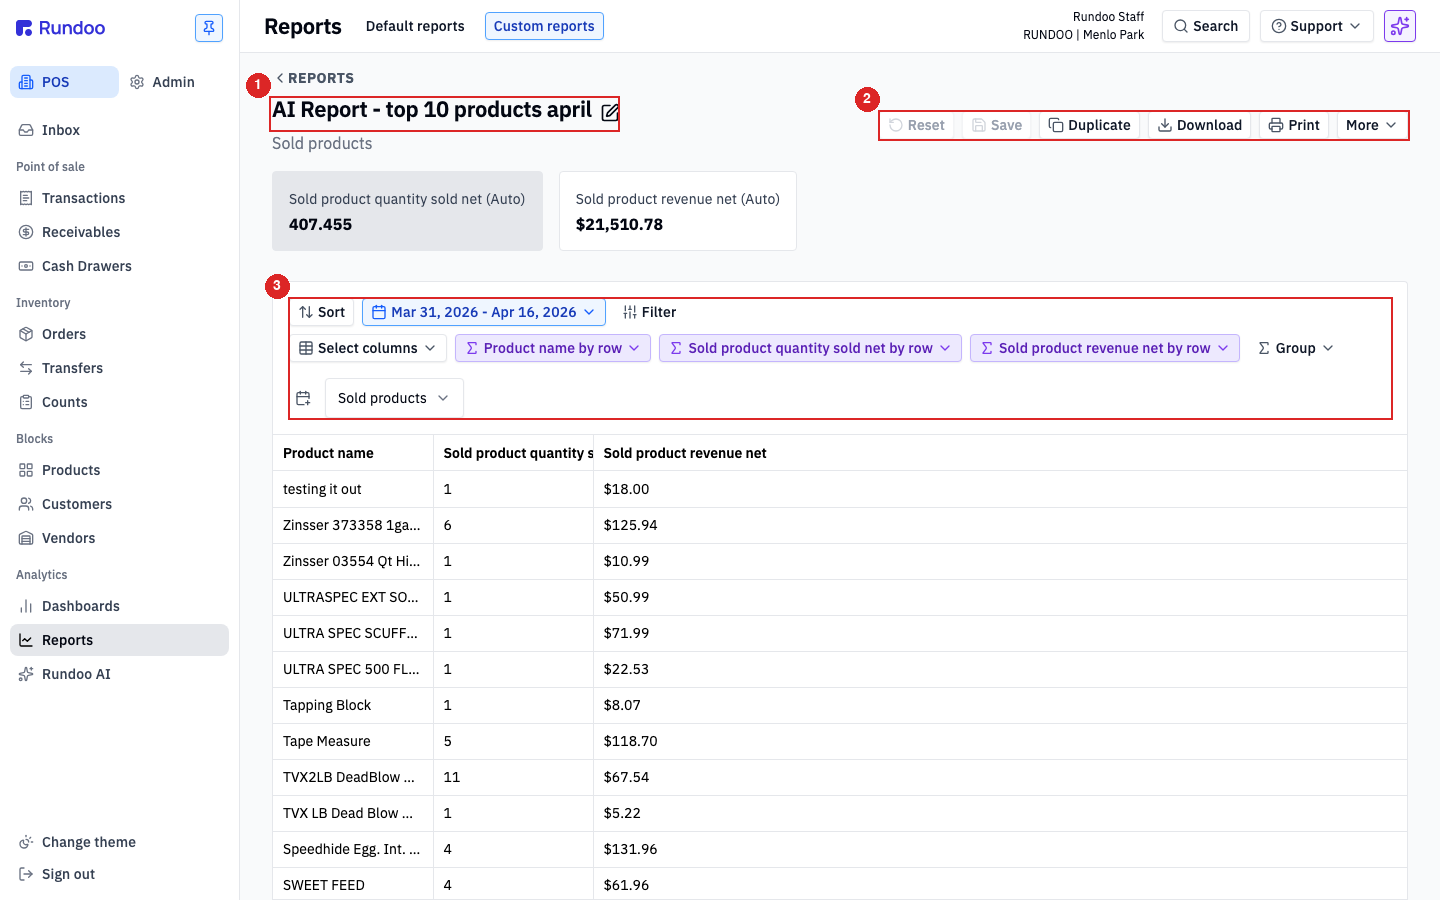
Say you want to see profit, not just sales. Click the white Select columns pill and check the fields you want, like Gross profit. Only the columns you pick show up, so you can keep the report to exactly what you need to read.
If you only want to look at one part of the business, click Filter, then Add filter, and choose an attribute like a location, a clerk, or a product category. Pick a value and the report narrows to just that slice. The list of things you can filter on depends on the report, so if the one you want is not there, that report does not track it.
One thing worth knowing: clicking a column heading sorts the report, it does not filter it. Filtering is always done from the Filter button.
Your grand totals are always right at the top of the report, in the summary tiles. When the numbers are what you need, head to the action cluster in the top right. Click Download for a full spreadsheet you can open in Excel, or Print for a clean PDF you can hand to someone.
Where
POS → Analytics → Reports
Dozens of default reports, ready to run.
Shape it
Date range · Select columns · Filter
Set the date first, then add columns and narrow.
Export
Download (CSV) or Print (PDF)
Top-right action cluster of the report.
Row limits
1,000 on screen · 50,000 in the CSV
Totals up top always count every row.
Good to know