Where
POS → Analytics → Reports
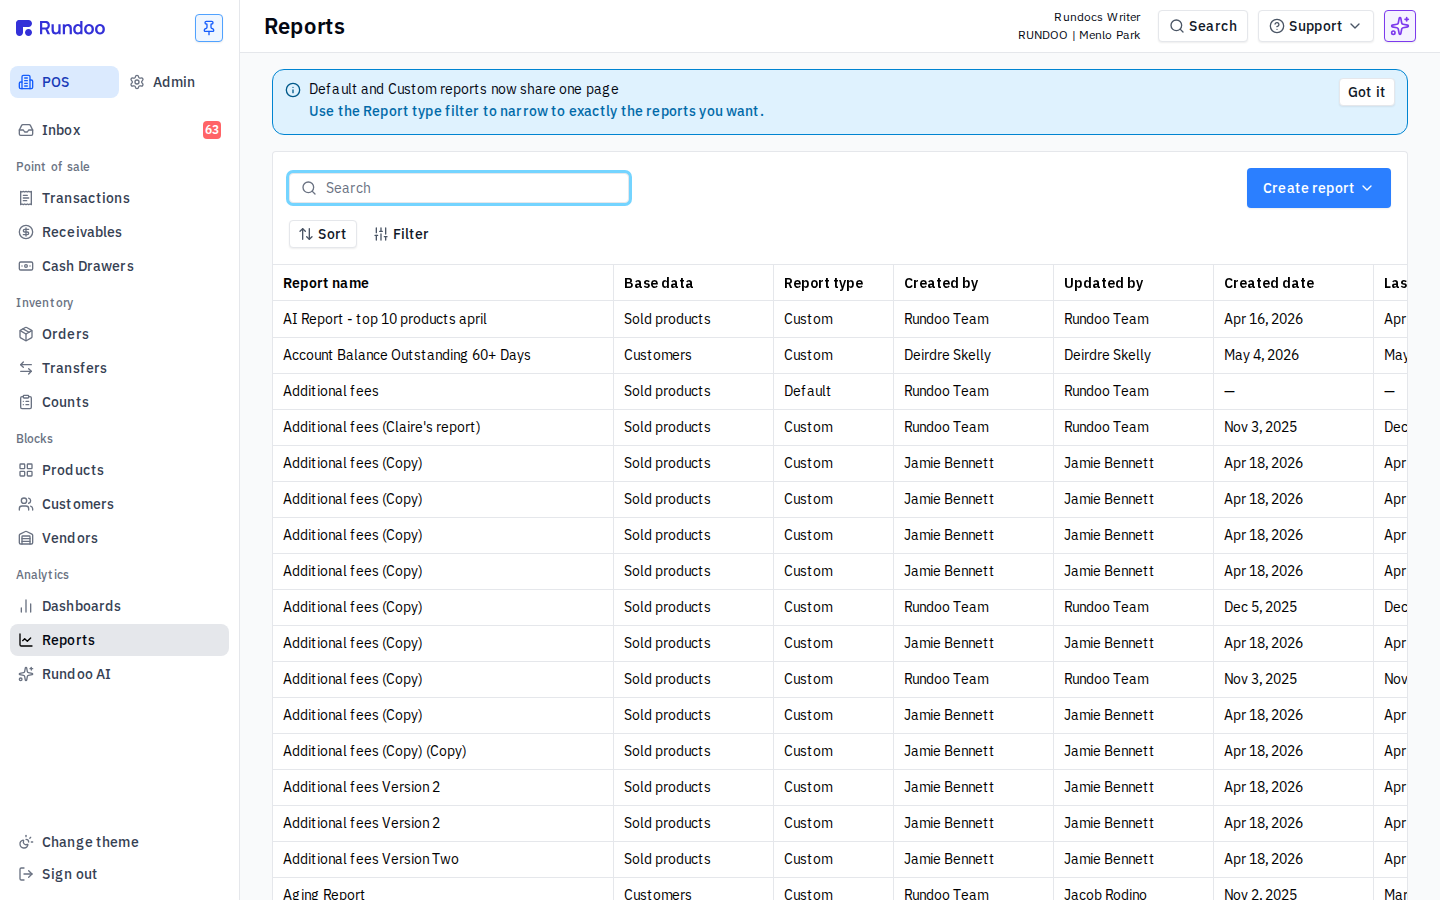
Defaults and custom share one page.

Getting Started with Rundoo · Setup
Build one, name it, and your whole team can run it again in one click.
You already know the handful of questions you ask about your business every week. Who owes me money that's overdue. What moved this month. Which items are gathering dust. Rundoo's built-in reports cover a lot of that, but not every question you have is on the list. When one isn't, you build your own: pick the data, shape it once, then save it under a name your whole team can reopen in one click. This is the video where you stop asking the same question over and over and turn it into a permanent answer.
In POS mode, open the Analytics group in the left sidebar and click Reports. Rundoo's roughly 50 built-in reports and everything your team has built sit on the same page. The Report type column tells them apart, and the Filter pill can narrow the list to just Report type = Custom when it gets long.
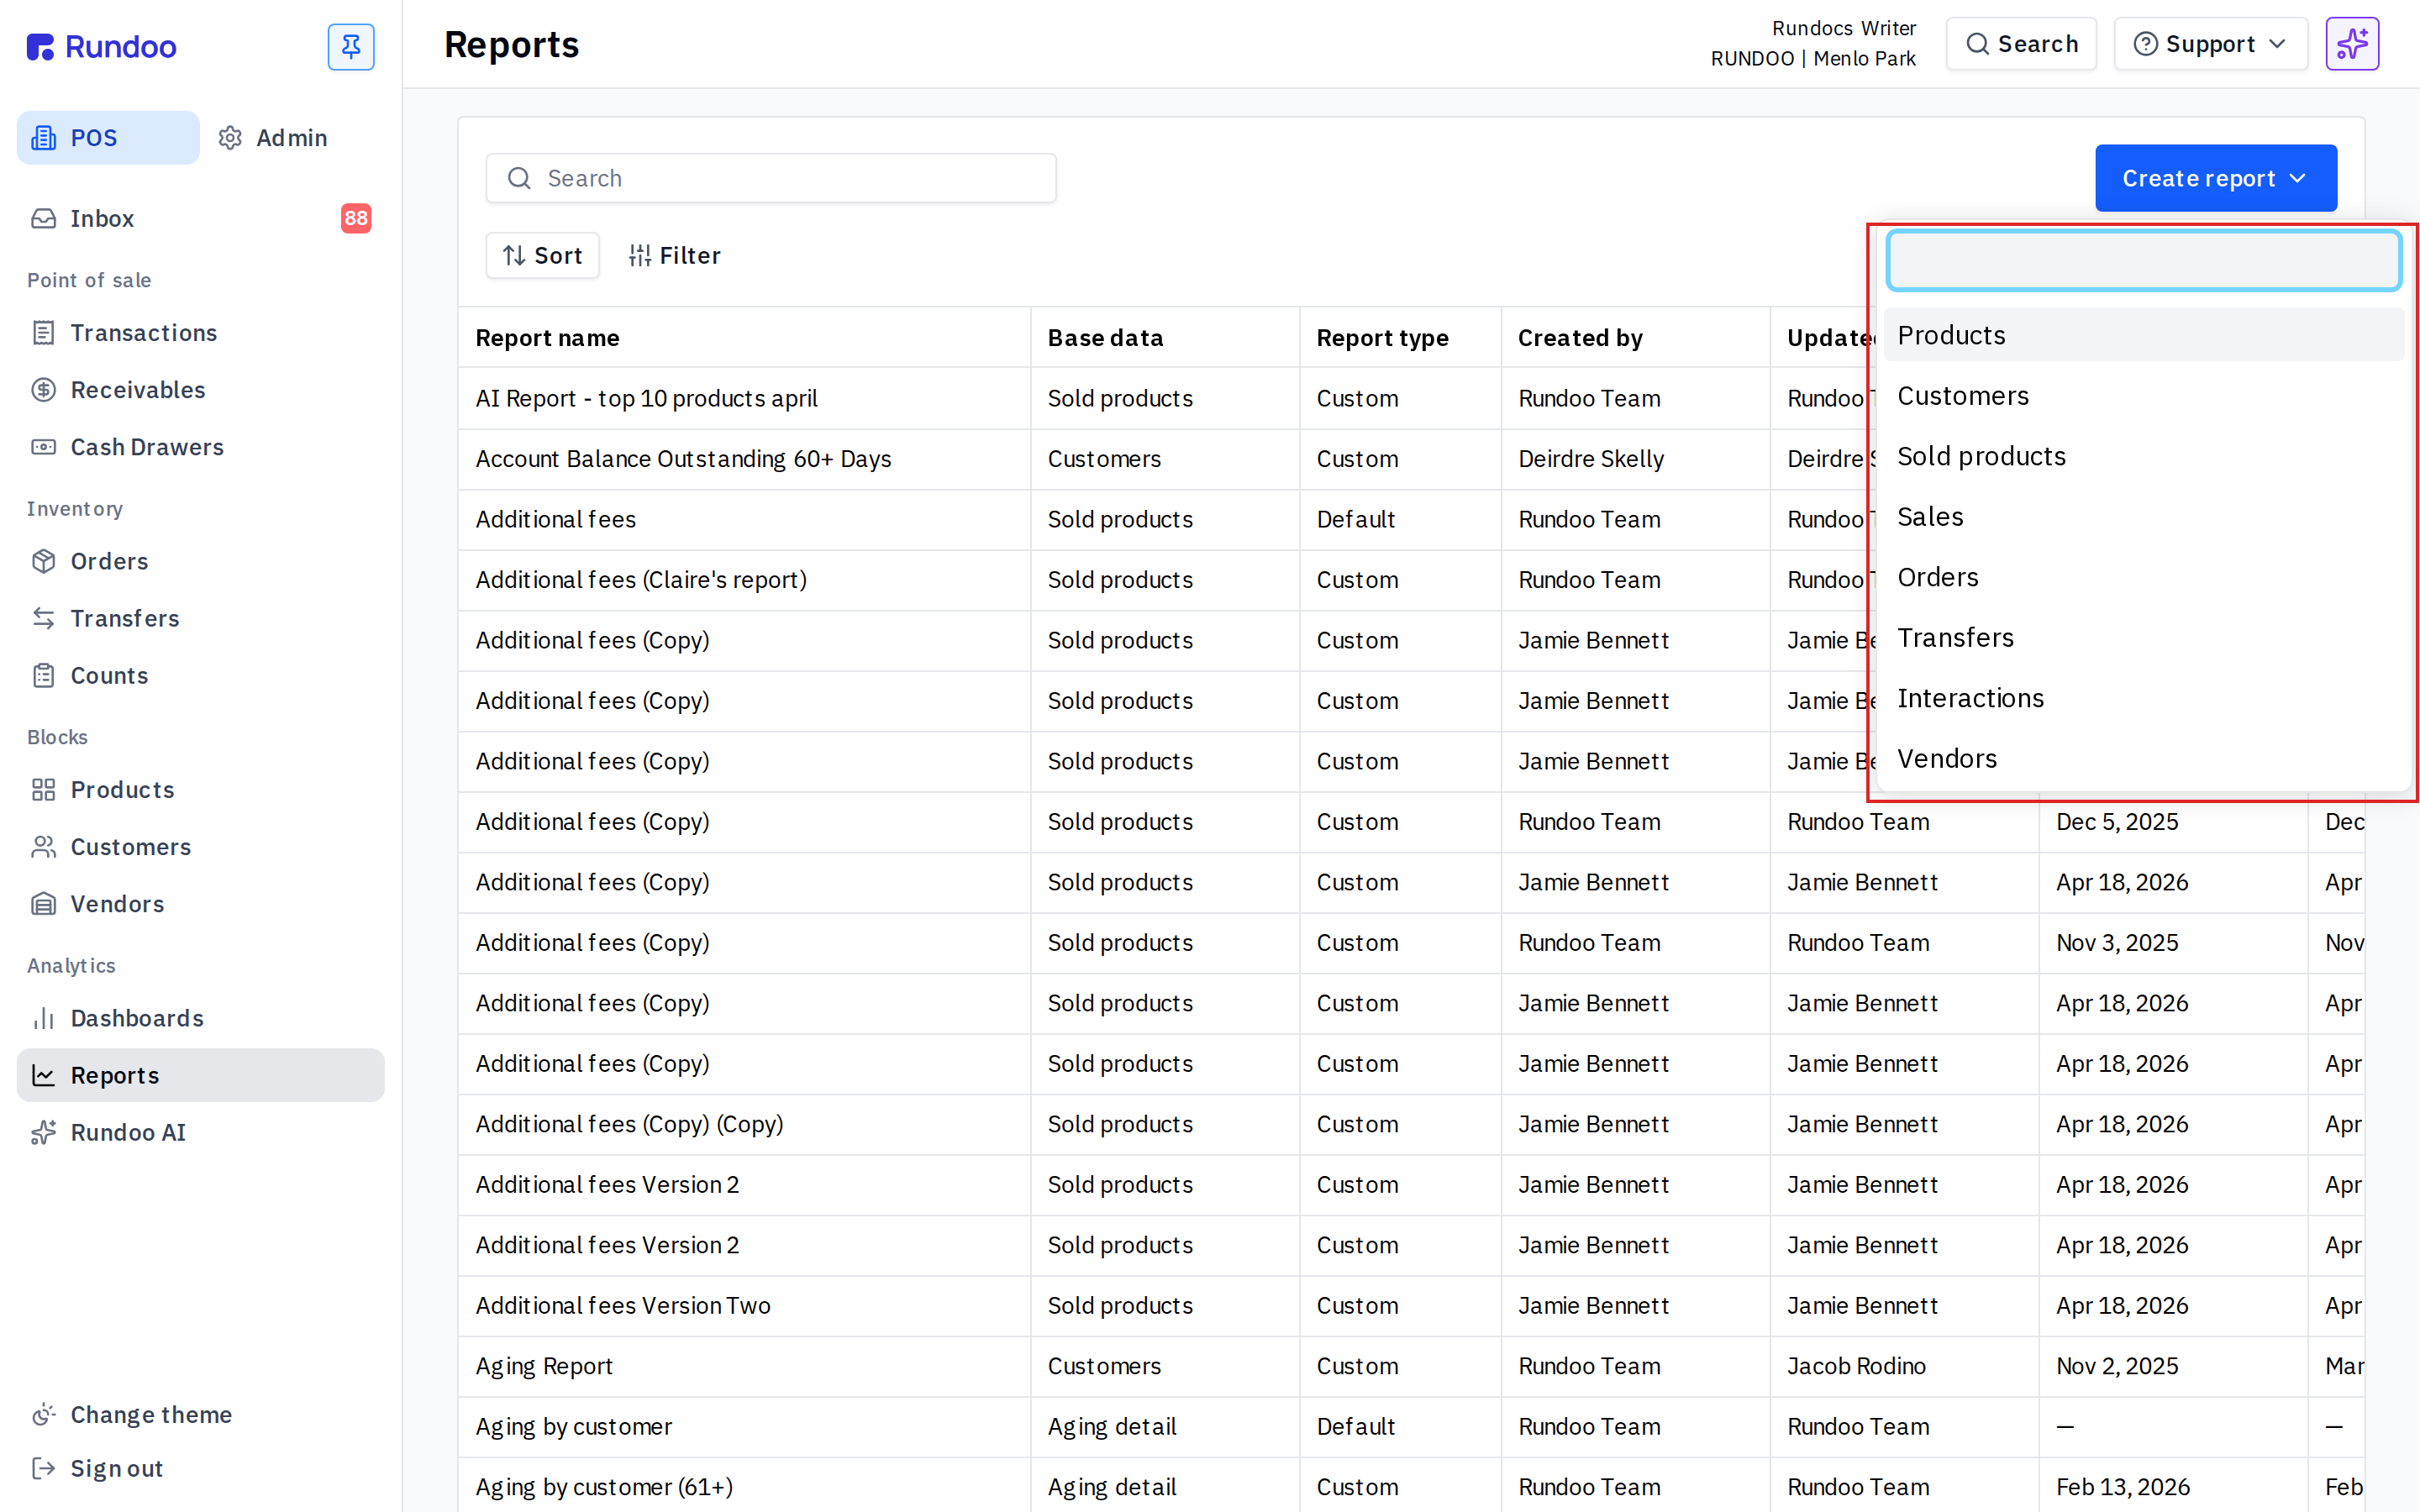
From the Reports page, click Create report in the top-right corner. If a built-in report is already close to what you want, there's a shortcut: open it, hit Duplicate, and edit the copy instead of starting from a blank one.
This is the most important choice on the whole page. The base data is the dataset your report pulls from, and it decides what a single row means. Think of it as choosing the shape of the row before anything else. Building a past-due call list? You want one row per customer, so choose Customers. The everyday datasets sit at the top of the list; scroll for more specialized ones like Transactions, Aging detail, or Price rules.
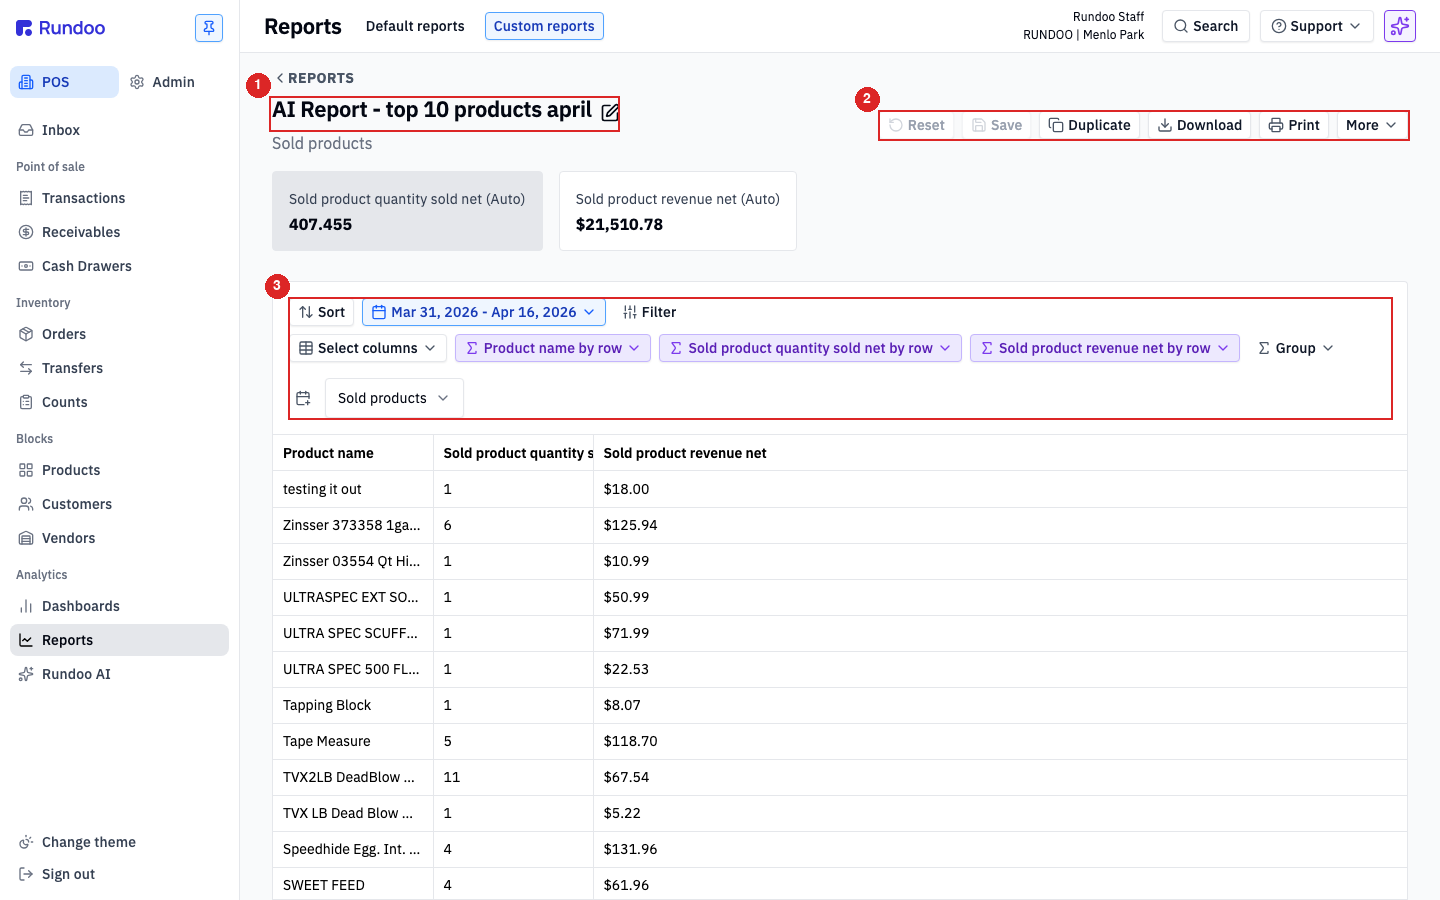
Now you're in the builder. Set the Date range pill to All time so an older account that hasn't transacted lately still shows up. Open Select columns and add what you need to make the calls: Customer name, Customer primary contact phone, and the three balance buckets, Customer balance 1 30 days, 31 60 days, and 61 plus days. Then click the 61 plus days column header to sort it high to low, and the most overdue accounts float to the top.
One thing to expect: there's no "balance greater than zero" filter in this dataset. Sorting and stopping when you hit the $0 rows is the quick way. If you want a clean spreadsheet, click Download for a CSV and delete the zero rows there.
When it looks right, click Save in the action cluster at the top-right. Nothing is permanent until you do, and the button stays greyed out until you've actually changed something. Rundoo gives it a default name, usually the dataset. Click the pencil icon next to the title and rename it for the job it does, like "Past-due customers call list." Name it the question it answers, not the dataset, so the next person who scrolls the list knows exactly what it's for.
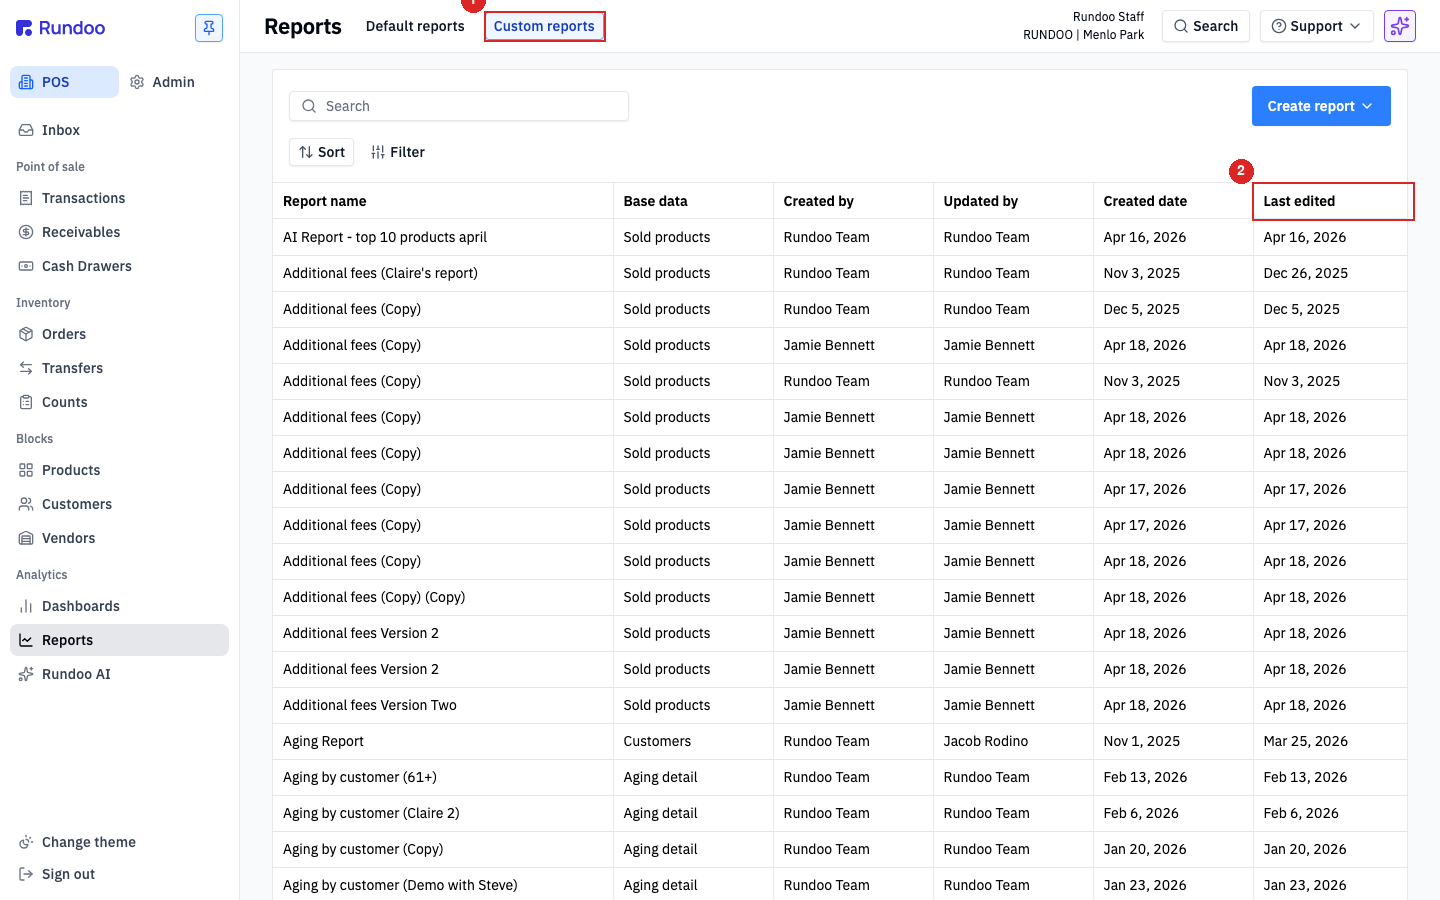
Your new report now lives on the Reports page, tagged Custom, ready to run anytime. Open it from the Custom reports tab and you land right back in the builder, pre-loaded with your columns and sort. Two things worth remembering: a custom report is a shared tool, so any edit you save updates it for the whole team, and there are no personal copies. If you want to try a different version without touching the original, hit Duplicate first. And because these reports are shared with everyone by default, the easiest way to point a teammate at one is to copy the link from your browser and send it.
Where
POS → Analytics → Reports
Defaults and custom share one page.
Start
Create report (top-right)
Or Duplicate a close default and edit it.
First choice
Pick the base data
It decides what one row means.
Save
Greyed until you change something
Then use the pencil to name it.
Good to know